Inequality, exhibit A: Walmart and the wealth of American families
Two weeks ago saw the 50th anniversary of the opening of the first Walmart. And just a week before that, the Federal Reserve released the underlying data on family wealth from the Survey of Consumer Finances (SCF). The SCF is the survey that reported the median wealth of American families (that is, the wealth of that American family that is exactly wealthier than half of all families and less wealthy than half) fell by 38.8 percent between 2007 and 2010.
We have argued previously that Walmart is a useful archetype for trends in the larger American economy over the past three decades. Its enormous size and bargaining power has led to fabulous wealth for its owners (most notably the Walton family), while the compensation it pays its employees is generally low, even by retail standards; and the ubiquity of Walmart stores means that it is effectively the marginal employer in many U.S. counties. And its role as this marginal employer often serves to drive down workers’ wages county-wide.
The three years of wealth data from 2007 to 2010 just provides an extreme example of how the economic fortunes of Walmart’s owners have diverged from those of typical American households. Concretely, between 2007 and 2010, while median family wealth fell by 38.8 percent, the wealth of the Walton family members rose from $73.3 billion to $89.5 billion (note that the 2007 wealth number is slightly larger than was reported at the time—to provide an inflation-adjusted comparison, I converted the 2007 wealth value of $69.7 billion to 2010 dollars using the consumer price index (the CPI-U-RS, to be specific)).
In 2007, it was reported that the Walton family wealth was as large as the bottom 35 million families in the wealth distribution combined, or 30.5 percent of all American families.
And in 2010, as the Walton’s wealth has risen and most other Americans’ wealth declined, it is now the case that the Walton family wealth is as large as the bottom 48.8 million families in the wealth distribution (constituting 41.5 percent of all American families) combined.
It’s hardly a surprise that the economic circumstances of the Walton family and that of most Americans are moving in opposite directions, but some have attempted to quibble with the use of this particular statistic by noting that nearly 13 million American families have negative net worth—meaning that they have outstanding debts greater than the value of their assets. This is a bit of a strange objection—of course, many American families have negative net worth, but this is an economic reality, not a statistical fluke.
It’s true that some of these negative net worth families are not necessarily families that are economically struggling: take a 27-year-old recent graduate of Harvard Medical School who has enormous student loan debt, but also has 40 or 50 or 60 years of very high earnings potential in front of them. However, it’s probably a safe guess that negative net-worth families that are actually very well-placed economically are a rare exception, and not the rule. And increasingly, many of these negative net-worth families are people who find themselves underwater in the wake of the housing bubble’s burst—as can be inferred in the large increase in the share of families reporting negative net worth between 2007 and 2010 (negative net-worth families rose from roughly 7.7 percent of the total in 2011 to 11 percent in 2011).
But still, these critics charge, the Walton wealth comparison is unfair because the negative net-worth families distort the whole calculation. Anyone with positive net worth, even $1, they point out, has more wealth than millions of American families.
Let’s take these critics’ suggestion and remove all the negative values at the bottom of the distribution, extinguishing the value of their debts that exceed their assets and assigning them a zero net worth instead. What does the comparison look like then? Not that different: After making this adjustment, about 15.4 million families (13.1 percent of the population) have zero net worth, no small number to be sure. But the Walmart heirs’ $89.5 billion is still equal to the combined net worth of the bottom 33.2 million families (about 28.2 percent of the total), even after extinguishing all negative net worth values in the SCF.
Again, it should be noted that this modification of the SCF is just not an economically sound thing to do; the negative net-worth observations in the SCF data represent economic information (let alone the realities of millions of families) that cannot just be discarded because people think that the number of families that need to have their wealth added together to sum to the Walton family’s total is arbitrarily “too high” in some way.
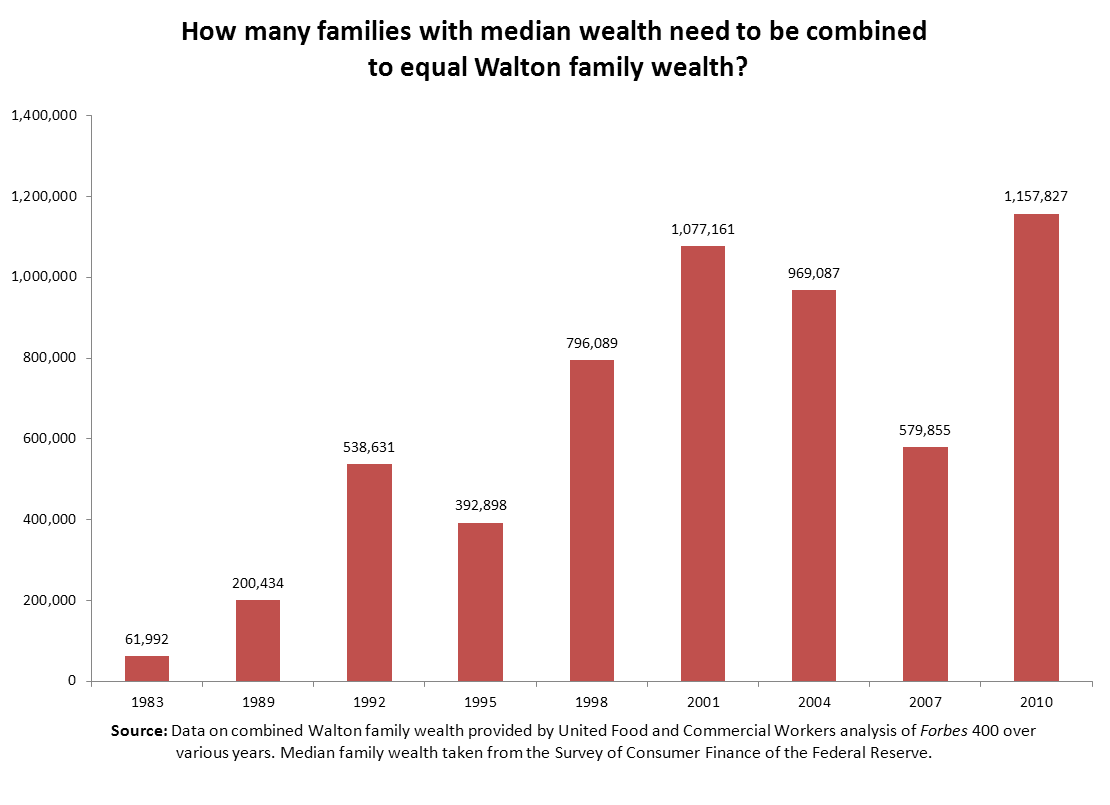
To address these points in one last way, take the wealth of the Walton family ($89.5 billion) compared to the wealth of the median American family—that family that is wealthier than half of all others and less wealthy than half. In 2010, median wealth was $77,300 (down from $126,400 in 2007). How many of these “typical” American households (i.e., those with median wealth—wealthier than fully half of the overall population) would you need to lump together to reach the Walton family’s wealth? About 1.16 million, up from 580,000 in 2007.
In short, it would still take a city’s worth of families with the overall median wealth to match the Walton family’s net worth. The figure below shows just how many families with median wealth would need to be combined to equal the Walton family’s wealth, and how this has changed over time.
Enjoyed this post?
Sign up for EPI's newsletter so you never miss our research and insights on ways to make the economy work better for everyone.